The infrastructure layer for hardware development

Closing the Feedback Loop on Hardware Development.

HILStart is bringing CI/CD to hardware. A small box, a web app, and an AI layer that lets you write tests, run them on real hardware, and let agents drive the loop, without the test infrastructure that usually takes a team and a year to build.

RIG_01 · Online Latency 4 ms Workspace · main
composer.hilstart.io
The HILStart loop

Three steps. Real hardware. No test engineer.

01 / Write

Tests as visual node graphs.

Drag, connect, configure. Composer turns a bench-top procedure into a structured test that reads like natural language. Set a signal, wait, read, assert, branch on outcome, loop until pass. No code, no test framework, no waiting on a test engineer.

  • Reusable from prototype to production. The same test you write on day one of a board bring-up runs unchanged on the production line.
  • Built for hardware, not retrofitted to it. Native handling of timing, edges, analog thresholds, and bus protocols.
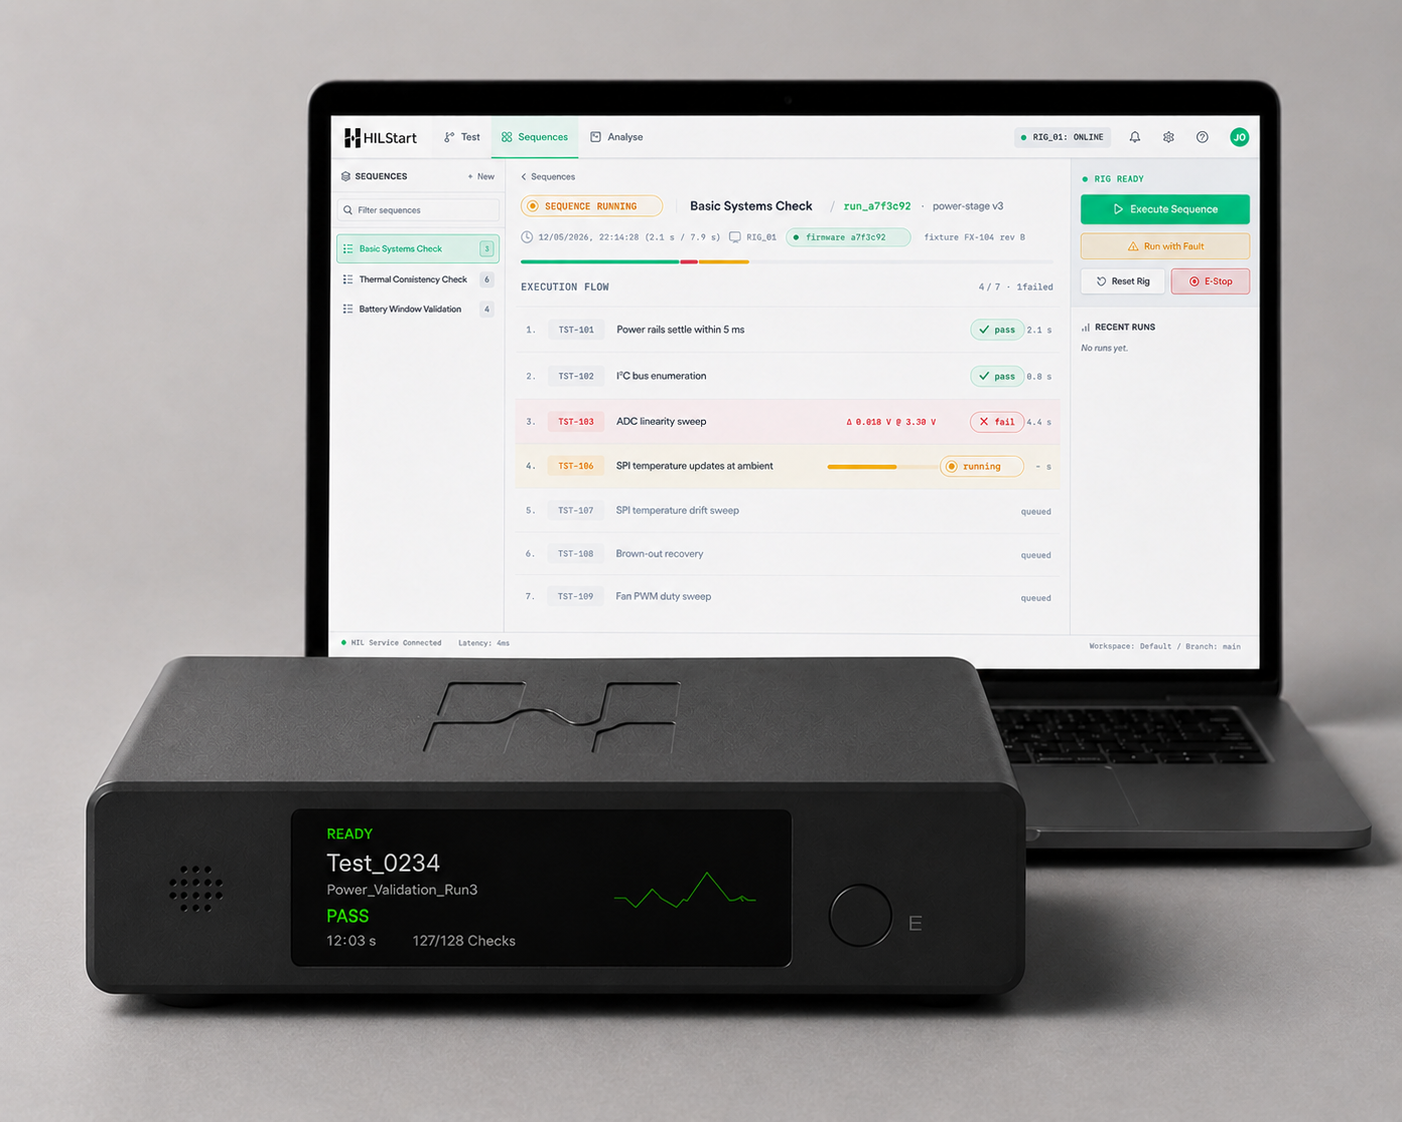
composer.hilstart.io / tests / TST-106 / SPI Temperature Updates At Ambient
START Set Analogue Signal battery_v Value 7.4 Wait Duration 5 ms Read Signal Source spi.temp Assert Range RANGE 18 → 28 MAX Δ ±18 → 28 pass END ABORT
02 / Run

Sequence and execute on real hardware.

Group tests into a suite, pick a target, hit run. Tracer drives signals into your device and measures what comes back, the same physical loop a human would close at the bench, automated and repeatable. No fixturing scripts, no test infrastructure to build.

  • One device on your bench, or a thousand devices on a production line. Same flow, same tests, same evidence format. Scale changes; none of your infrastructure does.
  • Pinned to the device under test. Every run captures firmware version, fixture revision, and rig configuration, so a result from today reproduces on a different bench tomorrow.
composer.hilstart.io / runs / RUN-2024 / power-stage v3
SEQUENCE RUNNING Basic Systems Check / run_a7f3c92 · power-stage v3 12/05/2026, 22:14:28 (2.1 s / 7.9 s) RIG_01 firmware a7f3c92 fixture FX-104 rev B EXECUTION FLOW 4 / 7 · 1 failed 1. TST-101 Power rails settle within 5 ms pass 2.1 s 2. TST-102 I²C bus enumeration pass 0.8 s 3. TST-103 ADC linearity sweep Δ 0.018 V @ 3.30 V fail 4.4 s 4. TST-106 SPI temperature updates at ambient running — s 5. TST-107 SPI temperature drift sweep queued 6. TST-108 Brown-out recovery queued 7. TST-109 Fan PWM duty sweep queued
03 / Analyse

Every signal, every datapoint; visible and comparable.

Inspect signals, diff against the last run, trace a regression to the commit that caused it. Every run is a versioned bundle of what was driven, what was measured, and what changed, and that bundle is the same artifact whether it came from R&D, QA, or the production line.

  • Side-by-side run comparison. Catch regressions on the commit that caused them, not in the field three months later.
  • One source of truth across the lifecycle. The same evidence format from the first prototype to the millionth unit off the line.
composer.hilstart.io / runs / RUN-2024 / analyse · main
TEST FAILED Basic Systems Check / run_a7f3c92 · Temperature Sources Agree 12/05/2026, 22:18:04 (4.4 s) RIG_01 temp_consistency: Δ 15 °C @ compare point RUN HISTORY main · last 8 ba7e cc09 3aee 71b8 e02f a7f3 9c11 d4a2 TEMP_SENSE — ANALOGUE vs SPI analogue spi (sampled) COMPARE · OK COMPARE · FAIL Δ 15 °C 70 60 50 40 30 20 °C 0s 0.10s 0.20s 0.30s 0.40s 0.50s PEAK Δ +15 °C analogue 65.0 vs spi 50.0 TOLERANCE ±0.5 °C breached 7× over window SPI CAP 50.0 °C analogue plateau 65.0 °C FIRST FAIL a7f3c92 3 commits ago
HILStart Assist

The AI layer that works on real hardware.

Most AI tools for hardware engineers are wrappers around a chat window, guessing from documentation. HILStart Assist isn't. It has full context on your tests, device profiles, and run history. It can drive your hardware directly through Tracer to verify its own work. Ask it a question, and it runs a test to find the answer.

Authoring

Writes tests for you.

Describe what you want to validate. Assist drafts the node graph against your device profile, runs it on your hardware, checks the result, and revises if needed. Edit, run, done.

Diagnosis

Analyses results for you.

Point Assist at a run. It surfaces what changed, what failed, and why, using the actual signal data from the bundle. The kind of analysis that takes an experienced engineer an afternoon, in seconds.

Monitoring

Flags anomalies in production.

Assist watches your fleet's run history and alerts you when behaviour drifts from baseline. Catch the slow regressions that don't trip a single test but tell you something's wrong before customers do.

All in natural language. All grounded in real, verifiable data from your hardware.

Playground

Your bench, in a browser.

Tracer doesn't only run tests. Plug it into your device, open Composer, and drive signals directly. Generate a waveform, sweep a parameter, scope a bus, log a sensor. The same box that runs your automated tests is also the most capable piece of bench gear on your desk.

  • One device replaces a stack of them. Function generator, oscilloscope, logic analyser, programmable power supply, bus sniffer. All of it, in the box, controlled from the browser.
  • Find a bug once. Catch it forever. When you find an issue debugging in Playground, capture it as a test. The same workflow that exposed the bug on your bench now runs on every board leaving the production line.
composer.hilstart.io / playground Coming soon
Bring your own agent

Firmware that compiles isn't firmware that works.

Coding agents can write firmware. They can't tell you whether it meets requirements. Claude Code, Cursor, and the rest are flying blind the moment their code touches hardware, which means the loop they close so well in software stops at the device boundary. Tracer extends it across.

Plug in the agent you already use.

Tracer exposes hardware control and signal capture through MCP. Your agent can drive a GPIO, read an ADC, capture a bus, or run a Composer test, the same way it already reads files and runs commands.

Pass/fail feedback the agent can act on.

HILStart tests are unit tests for hardware. They run on the real device, return clear pass/fail results, and give the agent the same kind of direct feedback that made AI coding work for software. The agent writes firmware, runs the test, sees what failed, fixes it, and repeats.

The platform

Two components. Sold as one system.

HILStart is hardware and software, built together, sold together. Plug Tracer into your device, open Composer in your browser, and you have a complete hardware testing environment. No drivers to install, no rack to assemble, no license server to configure.

Composer in the browser connects to Tracer over Wi-Fi. Tracer drives and measures a device under test, returning versioned evidence. CONTROL PLANE MEASUREMENT PLANE Composer Runs in your browser LAPTOP · WEB APP Tracer Real hardware runner ONLINE Device under test Your board or product DUT · FIXTURE · SENSORS WI-FI DRIVE SIGNALS CAPTURE MEASUREMENTS RETURN RESULTS

Tracer

The hardware. A small box that drives signals into your device and measures what comes back. One model, modular by design.

Composer

The software. A web app that runs in your browser. Where you write tests, sequence runs, inspect signals, and review results.

Modular expansions coming soon: analog, power, and high-speed bus domains.

FAQ

Will this work for my setup?

What equipment do I need to get started?
A laptop, your hardware, and Tracer. That's it. No rack, no licensed software, no test infrastructure to build first. You plug Tracer in, open Composer in a browser, and you're running.
How does Tracer connect to my hardware?

Three options. Same Tracer, same tests, regardless of which you use.

  • Bring your existing probes. High-density connector breaks out into banana plugs, 2.54mm headers, BNC, or whatever probes you already use.
  • Design for Tracer. Add a high-density connector to your PCB that breaks out the test points you care about, and Tracer plugs straight in.
  • In production. Tracer directly connects to your pin jig interface board.
What kinds of devices can Tracer test?
Anything an embedded engineer works on. Tracer drives and measures the signals that matter at the board level (GPIO, analog, PWM, SPI, I²C, UART, CAN, and power rails) and at the system level it drives actuators and reads sensors, so the device under test can be a full product: a robot, a drone, an appliance. The interface to Tracer is the same in either case.
What real-time guarantees does Tracer provide?
Tracer executes tests on a dedicated real-time core with millisecond-level timing accuracy, suitable for the vast majority of embedded test workloads. Sub-microsecond edges and high-speed bus capture are on the modules roadmap.
How does this fit into my CI?
Composer exposes an API for triggering runs and pulling results, and Tracer is designed to live in a permanent test rig as easily as on your bench. Most teams plug HILStart into their existing CI as a hardware-in-the-loop stage that runs on every firmware change.
What does it cost?
Tracer hardware is low cost by design, and software pricing scales with how much you use the platform. Talk to us for specifics.
Contact

Close the loop on your hardware.

We're working with a small group of early-stage hardware teams to refine HILStart through real R&D use. Tell us what you're building and we'll set up a call.